
Industry
Cybersecurity
Client
Cobalt
Services
Systems Design, Interaction Design, Visual Design
Replacing Manual Oversight with Automated Behavioral Signaling

How might we replace manual status-hunting with a single signal that tells TPMs not just what's happening, but what actually needs their attention right now?
Challenge
Cobalt’s Technical Program Managers each oversee a rotating book of 40–60+ penetration tests at a time, with 240+ live across the org at any given moment. TPMs were spending roughly two hours a day just reconstructing the current state of their tests — not fixing anything, just figuring out what needed attention.
The existing admin dashboard told them what was happening but not how or why a given test needed intervention. Context was scattered across pentest briefs, finding comments, and Slack channels, so problems typically surfaced only after they’d already escalated into missed SLAs or disputed findings.
Approach
I started with technical discovery: reviewing the full list of available pentest flags, their logic triggers, and mapping each to the pentest states they applied to, so I understood the raw signal set before designing anything on top of it. In parallel, I interviewed TPMs about their operational mental models — how they actually triage a book of 40–60 tests day to day.
My first prototype (built rapidly in Google AI Studio) grouped flags by count in a filterable grid, organized around the flag itself. It didn’t hold up:
No noise reduction — flags were grouped without actionable pentest-level attribution
Confused reception — TPMs understood the underlying logic but had nothing clear to act on
Wrong unit of organization — many tests carried multiple flags, so flag-level grouping fragmented a single test’s status across the UI
Scalability risk — TPMs asked to customize which flags surfaced, which would only compound the noise as more flags were added over time
That failure forced me to reframe the original question.
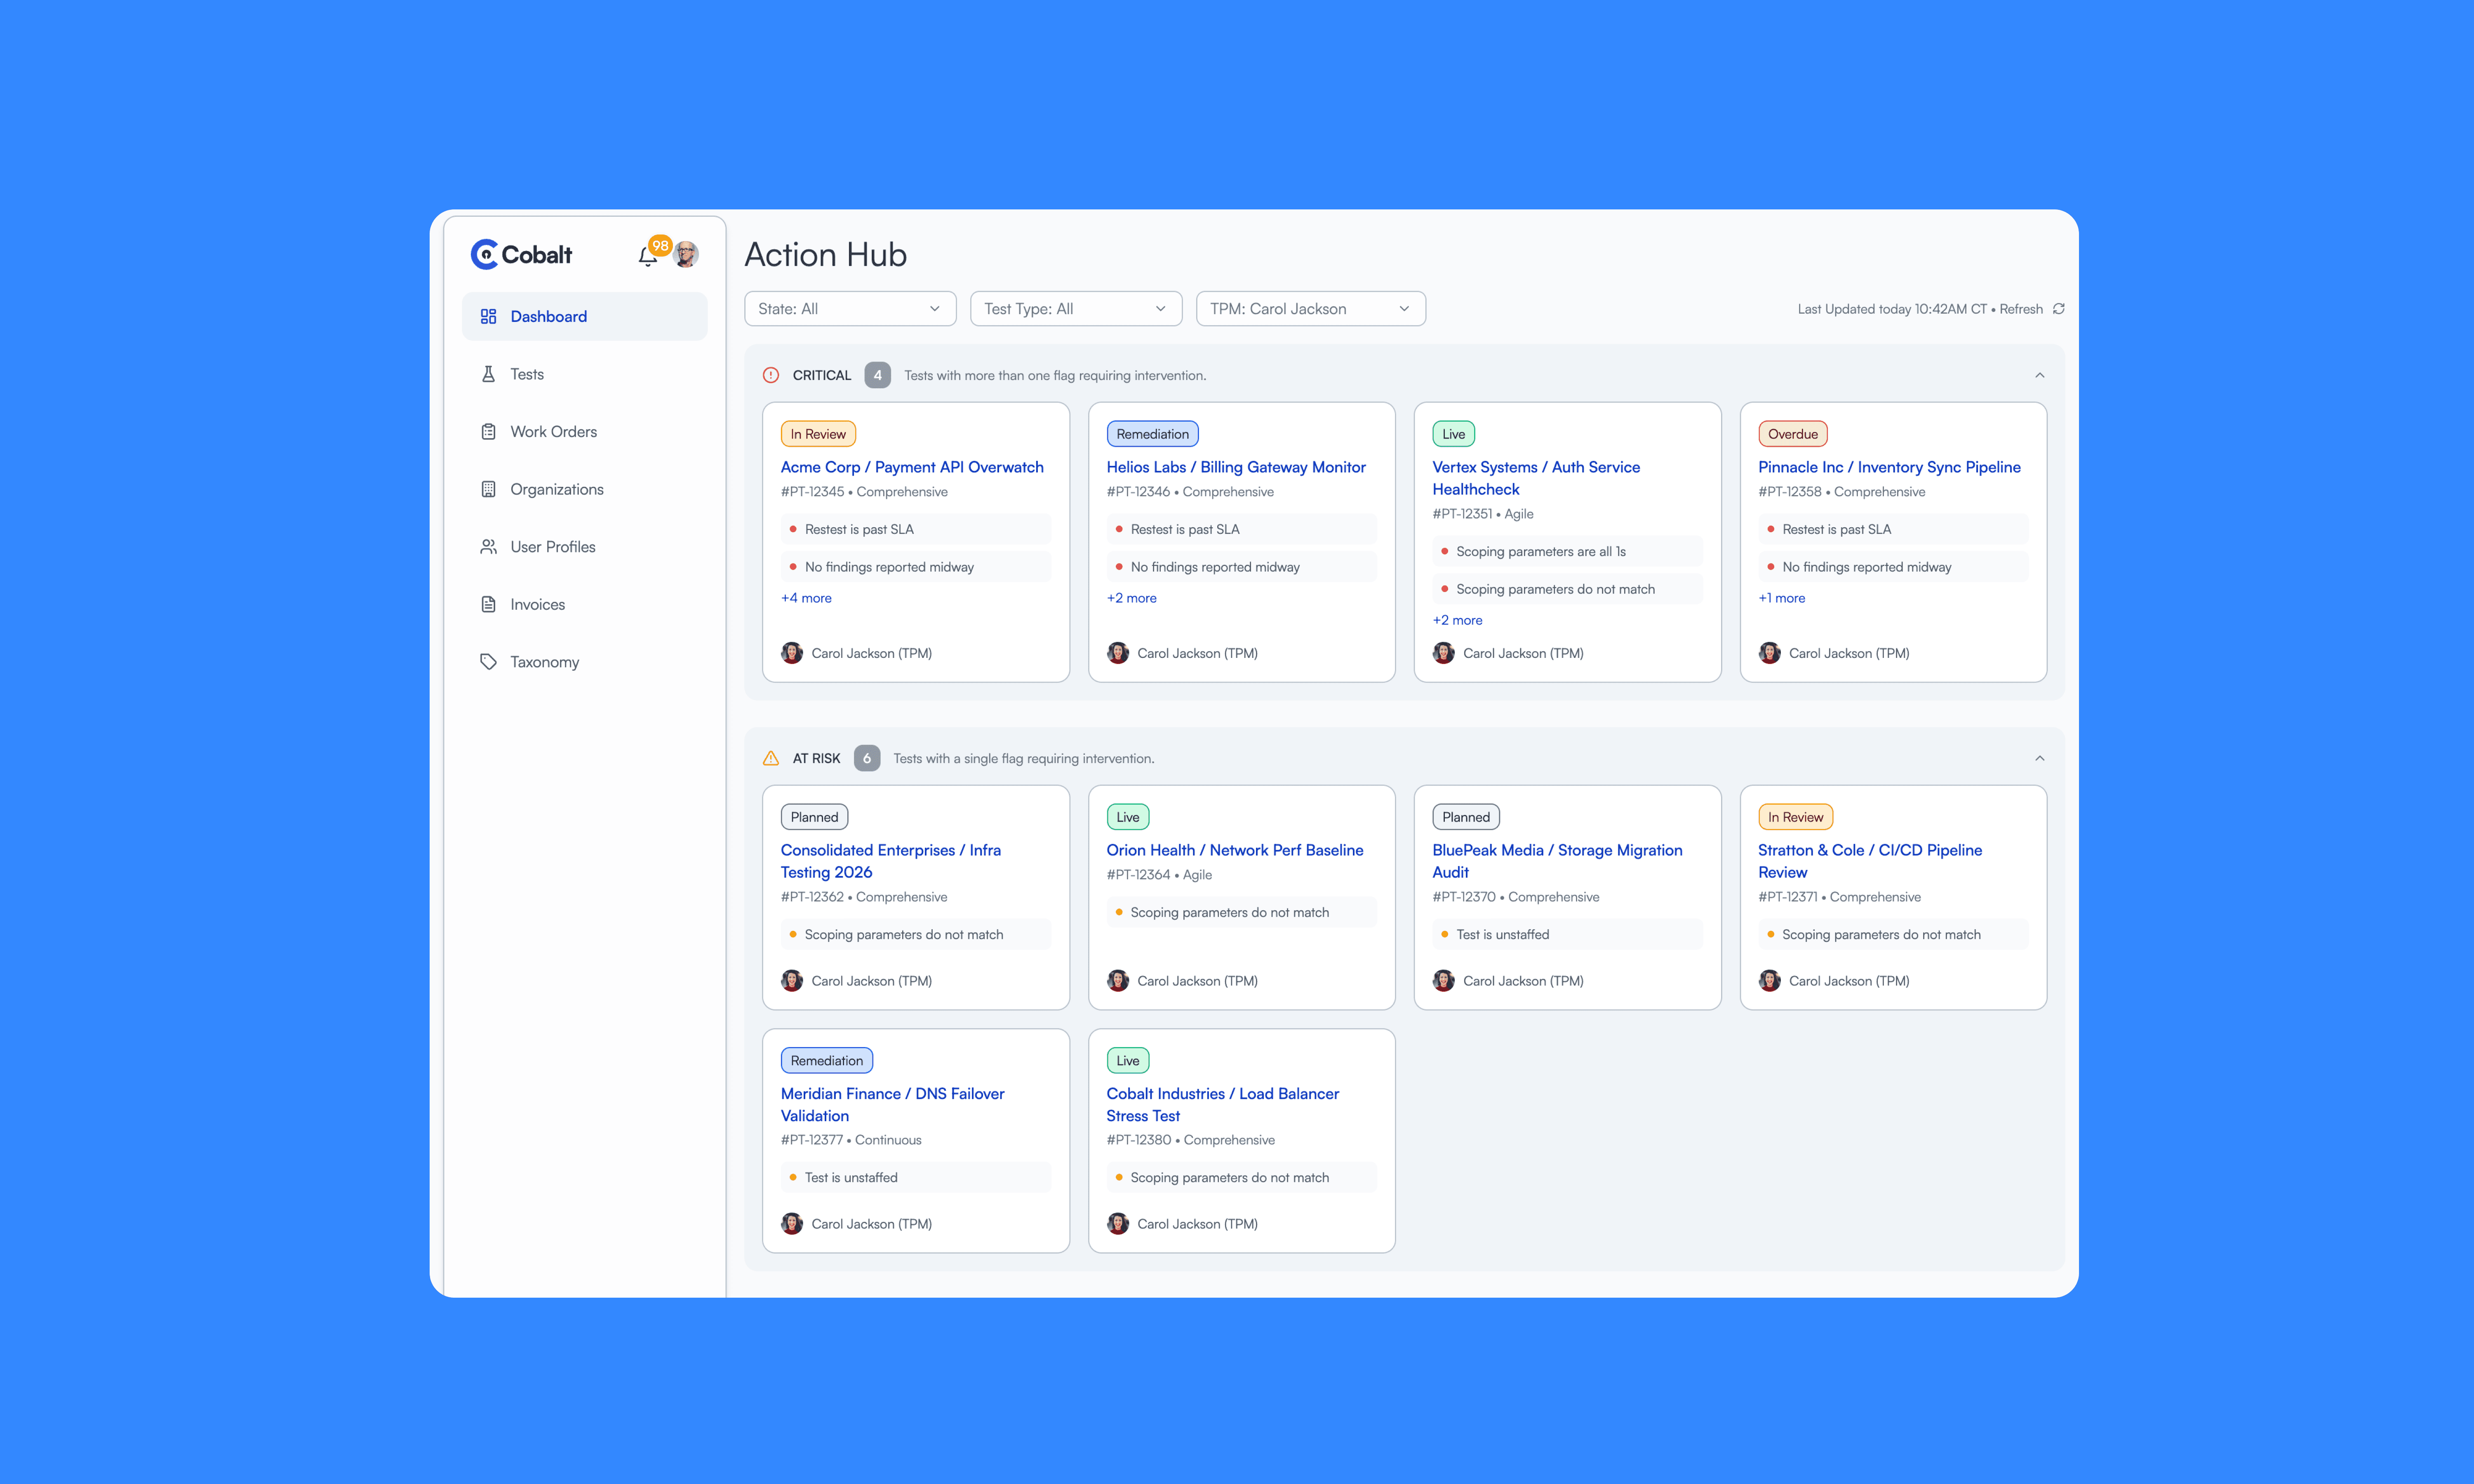


How might we create a meta-indicator that captures and computes all flags and signals for a single pentest to drive critical actions?
Solution
I designed a Pentest Health Score — a weighted indicator, starting at 100 (Perfect Health), that deducts points based on the severity of whatever’s been triggered on that test:
Minor flag (–5 pts): a small delay in a daily update
Major flag (–15 pts): a “Live” test with no findings for half its duration
Critical flag (–30 pts): missed delivery SLA or blocked tester access
That single score now drives the whole surface:
The dashboard groups tests by health tier (Critical / At Risk / Stable) instead of a flat list
The pentest detail page leads with a critical-status banner and Resolve/Dismiss actions
The table view carries a dedicated Health Rank column
The score is exposed anywhere in the UI via an interactive tooltip, so context travels with the number instead of living in a separate view
The system launched with 11 pentest flags, each one linking out to the relevant context (pentest brief or Slack channel) and labeling the responsible actor — tester or Customer Manager — so a TPM never had to guess who to go to. It was built to scale: initial-release scoring logic was intentionally simplified to ship faster, with the fuller weighted model staged for later iterations as more signals get added.
Impact & Learnings
Cut daily manual-review time per TPM from ~2 hours to under 30 minutes, a ~75% reduction in time spent reconstructing status instead of resolving it
Reached 100% TPM adoption, rolled out to all 8 TPMs over a 4-week period, with the health score fully replacing manual status-hunting as the default triage workflow
Validated across four stakeholder review rounds as a clickable prototype before shipping to production in Q3 2026
Turned tribal knowledge into searchable history — resolution notes now document the “why” behind every cleared flag, rather than living in Slack threads
Consolidated 11 disparate signal sources into a single, extensible score, designed so new flags can be added as the product evolves without re-cluttering the UI
Project Details
Who: Design (me), Product, Engineering, plus close collaboration with Cobalt’s TPM team throughout
How long: 1 quarter (Q2 2026 design and validation, Q3 2026 production rollout)
What tools: Figma, Subframe, Claude, Google AI Studio
New Design System and AI workflow: this work also ran concurrently with the design team's broader design-system buildout, so the shipped UI reflects the new components, fully exportable in code.